Showing posts with label Metatrader 4 Indicator. Show all posts

Thursday, October 18, 2012

Hull Moving Average Collections for MT4

                                                         4 time frame Hull trend


Hull candles


Hull moving average 


Hull moving average histogram


Hull ribbon


Saturday, October 6, 2012

Volume Spread Analysis Indicator for MT4


                                            Volume Spread Analysis  SonicR VSA indicator


Volume Spread Analysis BetterVolume indicator


Volume Spread Analysis  Bar Signals


Volume Spread Analysis  Better&TickSeparat Volume Histogram 


Volume Spread Analysis Spread &WickHistogram


Monday, October 1, 2012

Heiken Ashi Indicator For MT4

                                                 4 Time Frame Heiken Ashi Smothed


Heiken Ashi Dema


Heiken Ashi MA T3 Alert MTF


Non lag  Heiken Ashi


Tuesday, September 25, 2012

GRaB candles indicator for MT4


GRaB candles indicator for mt4 create by Raghee Horner

Green candles are bullish, red are bearish, and blue is neutral. The color-coding of the candles are based upon where each candle closes: above the 34 period EMA high is green, below the 34 period EMA low is red, and between the 34 period EMA high and 34 period EMA low is blue


Sunday, September 23, 2012

SPOUTNIKH Trade System


Entry Long position rules

Open trade when first bar from fisher in H1 and flat trend in H1 are GREEN COLOUR
Exit : When both bar fisher+ flat trend are becoming RED COLOUR  then Close and Reverse


Entry short position rules 

Open trade when first bar from fisher in H1 and flat trend in H1 are becoming RED COLOUR
Exit : When both bar fisher+ flat trend are green COLOUR then Close and Reverse


Tuesday, September 18, 2012

Gone Fishing Trade System


TIMEFRAME: 4HR, DAILY (Shorter timeframes work but reduced winning %)

INDICATORS: FX Fish, MA_CROSS_OC

SHORT ENTRY

Down Orange arrow AND Red line on FX Fish indicator ENTER AFTER BAR CLOSES

Stop Loss: Last low

Take Profit: Lock in 30-50 pip then wait for closing signal 


LONG ENTRY

Up Blue arrow AND Green line on FX Fish indicator ENTER AFTER BAR CLOSES

Stop Loss: Last low

Take Profit: Lock in 30-50 pip then wait for closing signal

CLOSING SIGNALS

Out trade  if FX Fish turns a different color as well 


Double smoothed stochastic Trade System

This System use Double smoothed stochastic Indicator for Enter trade 

Pair : EURUSD
TF  :  M1 - M5
Sell when both Double smoothed stochastic and XO Indicator same red color

Buy when both Double smoothed stochastic and XO Indicator same Lime color

Set stoploss 20 pip and take profit 10 - 20 pip

Test is need trade demo account only , send comment if you have good filter


Monday, September 17, 2012

Rads Reverse MTF HAS Trading Systems


This is a MTF system and you can see on the chart what is going on on the other time frames. Every time frame will show you the current and the next three higher time frames for reference
Blue Line - main indicator. It is a 27 period T3 moving average

Orange Line - 27 T3 on next higher time frame.

Red Line - 27 T3 on next higher time frame.

Purple Line - 27 T3 on next higher time frame

Maroon Line - 729 EMA

Grey line - 2 period smoothed EMA

HAS and HAS Extension - This gives the main visual indication of the move. I added the extension to help identify false breaks.

Center Window - MTF HAS Bars. These bars show the HAS indicator on the current and next 3 higher time frames.

Bottom Window - T3 Stochastic. Again, somewhat smoother than a regular stochastic. Set to 21-5-3 seems to line up very well with the other indicators

This is a trend following system and so we look to enter and trade with the current trend on whatever time frame we are looking at. We want to identify reversal points and enter as close to the beginning of a trend as possible and add to our positions when possible

EA Trader Manager For Metatrader 4


e-Trailing


Automatic trailing stop for all positions that are open or will be opened in the future

Swiss_Army_EA


Allows managing trades using a large variety of methods: break even stops, trailing stops, setting/removing take profits and stop losses and variety of close-out conditions

TrailingWithPartialClose


Allows partial closing of positions when each target is reached. Includes 6 different types of trailing stops

Stealth TradeManager


Lots of Features with real Buy Sell Button
Copy mt4gui.dll and mt4gui2.dll to C:\Programs\YourMetaTraderplatform , Attach Ea on chart that all

                                    Download  EA Trader Manager For Metatrader 4


X – Man 4H Swing Trade Method


X – Man 4H swing trade method

Time frame - 4H
Pairs- Any pair you feel like trading (look for pairs thats trending)
Times- Any time of the day
Indicators - TDI with the blue bands, Synergy bars , SHI Channel , 4 EMA shift 0 ,
60 EMA shift 0.

Method is as follows :
 When Price is under the 60 EMA then we are in a downtrend so we sell the tops
 That is when the 4 EMA start to touch the 60 EMA and price touches the top of the SHI channel.
 On TDI you will see a breakthrough on the blue bands.

Your SL will be at the high in the downtrend or low swing in the uptrend
Your TP will be at the bottom of the channel in a downtrend and at the top of the channel in an uptrend or it can be equal to your SL or double or triple your SL
Be sure to check whre the daily PA is heading.
The daily PA should be heading in the same direction


Sunday, September 16, 2012

Metatrader 4 Stochastic Indicator Collections

                                                                      DIGISTOCH


Double Smoothed Stochastic 2


Stochastic DynamicZoneStoch


Stochastic Colored


Stochastic  Floating levels


Stochastic 2SigMAs MTF


Saturday, September 15, 2012

Metatrader 4 MACD Indicator Collections

                                                      Dema MACD zones & alerts


FX5 Dema MACD Divergence_v1.1


Macd - Rsi Adaptive


MACD Colored


T3 BbMacd MTF


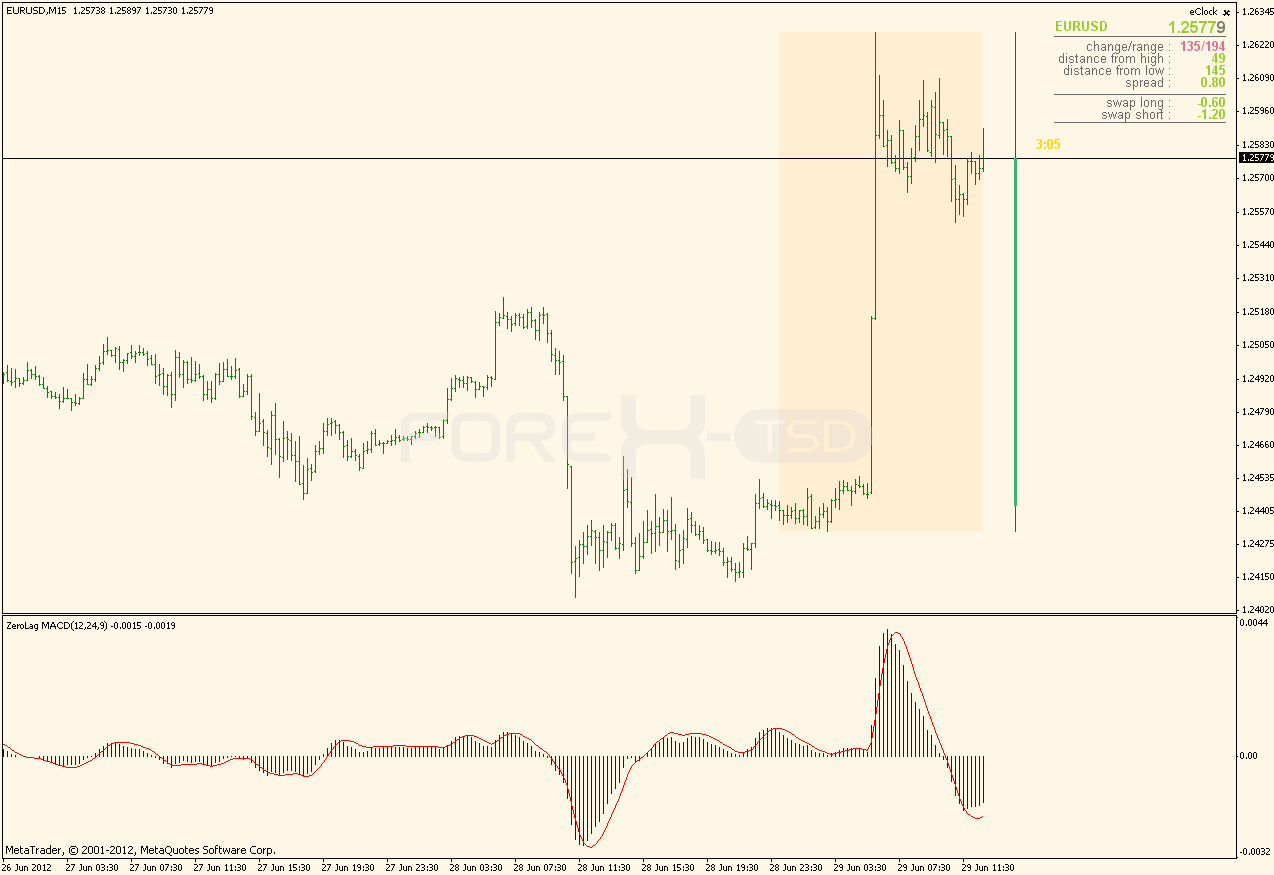
ZeroLag MACD


Thursday, September 13, 2012

SYNERGY Trading Method


The Synergy Trading Method was developed by Dean Malone and is an effective Forex trading method developed to simplify trading decisions with high probability precision. It combines the market forces of Price Action, Trend, Momentum and Market Strength to produce higher probability trades
With Synergy, traders identify and use two important trading components in real-time: Price Action and Sentiment.

Price Action is market movement, such as the oscillation of Open, High, Low and Close prices. Too often, traders are mesmerized by trivial price flucuations and lose sight of the underlying trend of the market. Many traders tend to jump in and out of the market instead of staying with the trade as a trend develops. Synergy is designed to eliminate price distortions. It reveals periods of market strength and trend and periods of consolidation.

Sentiment is the intuitive feeling or attitude of traders and investors in the market. For example, if the sentiment of the market is bullish, then traders and investors expect an upward move in the market. Often, sentiment is an indication of optimism or pessimism in the market based on recent news announcements or political events. The Synergy method uses a hybrid custom indicator developed to show postive (buyers) sentiment or negative (sellers) sentiment.

Working in unison, Price Action and Sentiment give traders a distinct trading advantage. When both are in agreement, favorable trading conditions exists. For instance, when price action is showing upward movement with buyers sentiment, there is higher probability of a Long position having a favorable outcome. Similarly, when price action has a downward movement in conjunction with sellers sentiment, a short position has a favorable outcome


4 Time Frame MT4 Indicator Collections

                                                            4 time frame awesome oscillator

4 time frame DeMarker

4 time frame Gann HiLo
4 time frame MACD


Wednesday, September 5, 2012

Genesis Matrix Trading System Tools


GMTS-Matrix is a non-repainting matrix indicator for use with the Genesis Matrix Trading System
Uses the following indicators:
1. TVI
2. CCI
3. Gann High/Low Activator Indicator
4. T3 Moving Average
Multi time-frame. All bars in the chart corresponding to a higher time-frame bar will be updated to reflect the current state of the higher time-frame indicator.
Optional alert when all 4 indicators line up.
Set labels of your choice.
GMTS-Tape:
GMTS-Tape is a tape chart of the ‘Genesis Matrix Trading System’ Matrix indicator.

GMTS-Dash
GMTS-Dash is a signal dashboard for the ‘Genesis Matrix Trading System’. It displays the current matrix signals for multiple time-frames and the ADR.

Stoch-MTF.mq4
MTF Stochastic with linear interpolation between bars on the higher time-frames. Features:
Linear interpolation of values between bars.
Dots can be used to tag the closing lower time-frame bar on the line.
Dual color to denote rising/over bought and Falling/oversold.


Stoch-MTF.mq4
MTF Stochastic Tape Chart Indicator. Features:

Divider line to group sets of lower time-frame bars to ease reading the chart.
Different colors for rising/overbought and falling/oversold

Credit to Xaphod