Tuesday, December 4, 2012

Latest Forex News 4-12

USD: Stocks proving to be soft into the NY close, down around 0.5%, but notable that the dollar was reluctant to show any perkiness as would normally be expected. Fiscal cliff seems to be giving it more of a headache.

EUR: Holding steady overnight. Eurozone finance ministers meet today and Greek bond buy-back continues, the success of which is key to ensuring Greece gets its next aid tranche.

JPY: Relatively steady overnight, but still a modest downward bias on USD/JPY owing to the extent of short JPY positions which some are deciding to cover; the upward momentum has waned.

AUD: The RBA cut rates by 0.25% to 3.00% as broadly expected. The Aussie was slightly firmer on the news, reflecting some hopes of bigger cut. Around half of initial bounce unwound.

GBP: BRC retail sales data showed 0.4% YoY on line for like retail sales. Up from -0.1% Oct number, but weaker than expected. Eyes firmly on level of Christmas demand this month.

Source

Monday, December 3, 2012

Latest Forex News 3-12

USD: The grand-standing around the fiscal cliff shows both sides retaining their entrenched positions with no signs of compromise. The dollar implications are becoming less clear as the market struggles to buy the dollar on a ‘risk-off’ strategy - at the same time that the country is heading for a fiscal car crash.

EUR: German Chancellor Merkel suggesting that in time, Greece could see some of its debts written-off. Comments reported in Bild newspaper, but caveat is it could only happen once budget is on sustainable footing

JPY: Weekly CME data showing yen shorts at highest for several years, keeping risks of further down-moves in USD/JPY as short yen positions are covered.

AUD: Retail sales data on the soft side, holding flat in October, having risen by a month average of 0.3% over the past year. AUD falling for 3rd consecutive day on the back of the release, which cemented view that RBA will cut rates on Tuesday.

GBP: House price data overnight (Hometrack) showing holding in negative territory at -0.3% YoY. Focus turning to Wednesday’s Autumn Statement from the Chancellor, in which further fiscal demands are expected to be imposed on the economy.

CNY: Various purchasing managers' data released over the weekend and today, all showing modest increases and offering further comfort to the view of a controlled soft landing in China.

Friday, November 30, 2012

Latest Forex News 30-11

EUR: Through the day-to-day noise, the euro has done reasonably well over the past two weeks. Still, to really attract attention, this current push higher would need to break through the September/October high and get above 1.32. Some worries that the Greek debt buy-back proposal is already unravelling.

JPY: Weaker overnight, some talk that it was related to Softbank’s purchase of Sprint. Japan’s government announced a JPY 880bn stimulus package, as mooted a few days ago.

AUD: Since early October, has respected a gently-sloping uptrend, although with an occasional wobble. These days trades more like a safe-haven currency than a high-beta one – yesterday it fell despite the fact that risk assets strengthened.

GBP: Had a healthy bid despite total lack of new news. Indeed, has looked comfortable for two weeks now, without really breaking any new ground. Needs to trade above 1.61 to really test the mettle of the bears.

Source Fxpro

Wednesday, November 28, 2012

Latest Forex News 28-11

EUR: Yet another case of buy the rumour (of a Greek debt deal) and sell the fact, with the euro retreating after running into a determined wall of sellers up at 1.30. Upbeat economic news out of the US helped the buck, as did month-end flows. Single currency may drift lower near term.

JPY: Yen shorts headed for cover again overnight, amidst rumours that the government in Japan would announce a massive fiscal stimulus on Friday. May see yen climb further in the very near term in what will be a big test of conviction for the bears.

AUD: Struggling very slightly, although not in a way that should cause too many alarms. Asian equities off by around 1% overnight and yet Aussie still fairly firm. Some traders alert to rising prospect of a rate cut next week.

GBP: Sterling got a lift yesterday as traders and investors alike responded positively to the news that Mark Carney had been appointed BoE Governor. Month-end flows probably helped the pound as well. Some of yesterday's gains have been diluted overnight

Source FXPRO

Monday, November 26, 2012

Black Friday online sales reach $1 billion


Black Friday retail sales online this year topped $1 billion for the first time ever as more consumers used the Internet do their early holiday shopping, Online sales jumped 26 percent on Black Friday to $1.04 billion , comScore source

Via reuters

Friday, November 23, 2012

Why Binary Forex Options are better than Spot Forex


This is most important, the reward to risk ratio on Binaries is FAR FAR superior than Sot Forex. You can buy your typical binary option for $20 per contract (and some you can buy for $5!) This means if you win, you gain 5X your investment, or what you risked! ($20 x 5 = $100) To do this on a Spot Forex Position you would have to travel into positive territory that is five times your stop loss! This rarely happens because the Forex market is like a whipping dragon, and it's hard to tell when a reversal is in progress. Most Spot Forex Traders that I know usually only have a take profit that is around the equivalent of their stop loss. This means that a lot of Spot Forex traders are only gaining what they risk.

You can’t get stopped out in Binary Forex Options. You’ll sleep better at night not having to worry about whether or not your position is going to get stopped out, despite the fact that price is ultimately going in the direction that you thought it was! (You can get timed out, of course, but when you consider there are WEEKLY Binary Forex Options, it's really not a problem.)

There is no sneaky broker problems like in Spot Forex. You don’t have to worry about requotes or widening spreads with Binary Forex Options. And you just don’t have to worry about stop hunting in general.

You can Hedge with a single account with Binaries Forex Options. And because your pay out is so much higher than what you invest/risk, hedging makes perfect sense with Binary Forex Options. Unlike Spot Forex, where the risk to reward ratio is relatively low. If you buy a binary contract for $25 and sell an opposing Binary contract for $25, the payout is $75 even after your losing side fails!

                                                                                                       Discussion here

Thursday, November 22, 2012

10 Warren Buffett Quotes You Must Know


1 .“Rule No. 1: Never lose money. Rule No. 2: Never forget Rule No. 1.”
2 . “You do things when the opportunities come along. I’ve had periods in my life when I’ve had a bundle of ideas come along, and I’ve had long dry spells. If I get an idea next week, I’ll do something. If not, I won’t do a damn thing.”
3.“  Never invest in a business you can’t understand.”
4  “It’s far better to buy a wonderful company at a fair price than a fair company at a wonderful price.”
5. “Only buy something that you’d be perfectly happy to hold if the market shut down for 10 years.”
6. “We simply attempt to be fearful when others are greedy and to be greedy only when others are fearful.”
7. “It’s better to hang out with people better than you. Pick out associates whose behavior is better than yours and you’ll drift in that direction.”
8. “Our favorite holding period is forever.”
9. “Only when you combine sound intellect with emotional discipline do you get rational behavior.”
10. “Without passion, you don’t have energy. Without energy, you have nothing.”


Wednesday, November 21, 2012

Gartley pattern Forex Trading


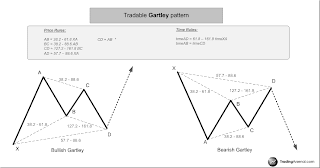
Mr. Gartley draw the pattern and it’s market context/location. In the late 1980 In the book Profitable Patterns for Stock Trading Larry Pesavento assigned certain ratios to define the pattern precisely. He measured each price swing from peak to trough as a certain percentatge of the proceding price swing. Pesavento required these percentages to be Fibonacci ratios: 61.8, 78.6 100, 1.27, 1.618


Problem is that it’s quite rare to see the Gartley pattern with exact precise Pesavento’s Fibonacci ratios. Some % delta or Fibo ranges must be used to expand the acceptable price swings ratios and produce more patterns, more trading opportunities. For example to allow XD retracement to be 57.7 till 88.6 rather than exactly 78.6


The importance and understanding of AB=CD in Gartley pattern


Credit to tradingarsenal

Wednesday, October 24, 2012

Bank of America Sued Over Alleged Mortgage Fraud

Bank of America Corp. (BAC) was sued by the U.S. attorney in Manhattan for allegedly engaging in a scheme to defraud Fannie Mae and Freddie Mac.

The complaint alleges that Countrywide Financial Corp., which was later bought by Bank of America, implemented a loan- origination process that generated thousands of fraudulent or defective loans that were sold to Fannie Mae and Freddie Mac, according to a statement today from the Manhattan U.S. Attorney’s Office

Via bloomberg


Thursday, October 18, 2012

Hull Moving Average Collections for MT4

                                                         4 time frame Hull trend


Hull candles


Hull moving average 


Hull moving average histogram


Hull ribbon


US Dollar Sinks Past Support


Prices turned lower from resistance in the 9928-38 area, marked by the late August swing bottom and the top of a falling channel set from the early June high. Sellers have now broken rising trend line support set from the September 14 low, exposing the next downside objective at 9823. A further push below that targeting 9740. Alternatively, a reversal through resistance initially aiming for 9985


Via Dailyfx

Monday, October 8, 2012

AAPL stock buyback program begins

Apple has now launched its plan to buy back some $10 billion in stock . The purchase plan spans three years and, although technically underway, is controlled by the discretion of the board, which will determine the best times in the coming 36 months in which to buy stock and in what quantities

Saturday, October 6, 2012

Volume Spread Analysis Indicator for MT4


                                            Volume Spread Analysis  SonicR VSA indicator


Volume Spread Analysis BetterVolume indicator


Volume Spread Analysis  Bar Signals


Volume Spread Analysis  Better&TickSeparat Volume Histogram 


Volume Spread Analysis Spread &WickHistogram


Wednesday, October 3, 2012

US Dollar Grinds Higher


US Dollar continues to grind higher through near-term resistance levels

Prices are testing through resistance at 9893, the 50% Fibonacci retracement level, to challenge the top of a rising channel set from the September 14 swing low (9905). A break above this boundary exposes the 61.8% Fib at 9929. Initial support lines up at 9857, the 38.2% retracement.


Via Dailyfx

Monday, October 1, 2012

Heiken Ashi Indicator For MT4

                                                 4 Time Frame Heiken Ashi Smothed


Heiken Ashi Dema


Heiken Ashi MA T3 Alert MTF


Non lag  Heiken Ashi


Tuesday, September 25, 2012

Fed's Plosser: Exit may come well before mid-2015


The Federal Reserve may have to raise short-term interest rates "well before" the current guidance of mid-2015 . 

Charles Plosser, FA Society of Philadelphia and The Bond Club of Philadelphia today . President and Chief Executive Officer of the Federal Reserve Bank of Philadelphia is speaking to the C

He said the that further easing wasn't appropriate nor likely to be effective. In additions, the actions carry with them "significant risks" to the Fed's inflation fighting credibility, he remarked. Plosser was relatively optimistic about the economy, forecasting 3% growth in 2013 and 2014.

GRaB candles indicator for MT4


GRaB candles indicator for mt4 create by Raghee Horner

Green candles are bullish, red are bearish, and blue is neutral. The color-coding of the candles are based upon where each candle closes: above the 34 period EMA high is green, below the 34 period EMA low is red, and between the 34 period EMA high and 34 period EMA low is blue


S&P lowers forecast for eurozone GDP growth in 2012 and 2013


Standard & Poor's Ratings Services said today that it now expects -0.8% GDP growth in the eurozone in 2012 and flat growth in 2013. For Spain, the forecast is now for a 1.4% contraction next year.

This compares with our previous projections in July for 2012 and 2013 GDP growth of -0.7% and 0.3% for the eurozone, and -0.6% for Spain in 2013.

Monday, September 24, 2012

US Dollar Rebound

Prices re-testing the previously broken bottom of a rising channel set from the September 14 low (now at 9831). A break higher initially exposes the 38.2%Fibonacci retracement at 9857. Near-term support lines up at 9783, the 23.6% Fibonacci expansion, with a break below that targeting the 38.2% expansion at 9738


Via Dailyfx

Sunday, September 23, 2012

SPOUTNIKH Trade System


Entry Long position rules

Open trade when first bar from fisher in H1 and flat trend in H1 are GREEN COLOUR
Exit : When both bar fisher+ flat trend are becoming RED COLOUR  then Close and Reverse


Entry short position rules 

Open trade when first bar from fisher in H1 and flat trend in H1 are becoming RED COLOUR
Exit : When both bar fisher+ flat trend are green COLOUR then Close and Reverse


Wednesday, September 19, 2012

Crude Oil reversal to the downside


Prices broke through support at the bottom of a rising channel carved out since early July to challenge the 38.2% Fibonacci retracement at 91.56. Continued selling below this boundary targets the 50% level at 88.83. The channel bottom – now at 94.54 – has been recast as resistance. A push back above that aims to challenge a falling trend line set from late February at 99.51


Tuesday, September 18, 2012

Gone Fishing Trade System


TIMEFRAME: 4HR, DAILY (Shorter timeframes work but reduced winning %)

INDICATORS: FX Fish, MA_CROSS_OC

SHORT ENTRY

Down Orange arrow AND Red line on FX Fish indicator ENTER AFTER BAR CLOSES

Stop Loss: Last low

Take Profit: Lock in 30-50 pip then wait for closing signal 


LONG ENTRY

Up Blue arrow AND Green line on FX Fish indicator ENTER AFTER BAR CLOSES

Stop Loss: Last low

Take Profit: Lock in 30-50 pip then wait for closing signal

CLOSING SIGNALS

Out trade  if FX Fish turns a different color as well 


Double smoothed stochastic Trade System

This System use Double smoothed stochastic Indicator for Enter trade 

Pair : EURUSD
TF  :  M1 - M5
Sell when both Double smoothed stochastic and XO Indicator same red color

Buy when both Double smoothed stochastic and XO Indicator same Lime color

Set stoploss 20 pip and take profit 10 - 20 pip

Test is need trade demo account only , send comment if you have good filter


Monday, September 17, 2012

Rads Reverse MTF HAS Trading Systems


This is a MTF system and you can see on the chart what is going on on the other time frames. Every time frame will show you the current and the next three higher time frames for reference
Blue Line - main indicator. It is a 27 period T3 moving average

Orange Line - 27 T3 on next higher time frame.

Red Line - 27 T3 on next higher time frame.

Purple Line - 27 T3 on next higher time frame

Maroon Line - 729 EMA

Grey line - 2 period smoothed EMA

HAS and HAS Extension - This gives the main visual indication of the move. I added the extension to help identify false breaks.

Center Window - MTF HAS Bars. These bars show the HAS indicator on the current and next 3 higher time frames.

Bottom Window - T3 Stochastic. Again, somewhat smoother than a regular stochastic. Set to 21-5-3 seems to line up very well with the other indicators

This is a trend following system and so we look to enter and trade with the current trend on whatever time frame we are looking at. We want to identify reversal points and enter as close to the beginning of a trend as possible and add to our positions when possible

EA Trader Manager For Metatrader 4


e-Trailing


Automatic trailing stop for all positions that are open or will be opened in the future

Swiss_Army_EA


Allows managing trades using a large variety of methods: break even stops, trailing stops, setting/removing take profits and stop losses and variety of close-out conditions

TrailingWithPartialClose


Allows partial closing of positions when each target is reached. Includes 6 different types of trailing stops

Stealth TradeManager


Lots of Features with real Buy Sell Button
Copy mt4gui.dll and mt4gui2.dll to C:\Programs\YourMetaTraderplatform , Attach Ea on chart that all

                                    Download  EA Trader Manager For Metatrader 4


X – Man 4H Swing Trade Method


X – Man 4H swing trade method

Time frame - 4H
Pairs- Any pair you feel like trading (look for pairs thats trending)
Times- Any time of the day
Indicators - TDI with the blue bands, Synergy bars , SHI Channel , 4 EMA shift 0 ,
60 EMA shift 0.

Method is as follows :
 When Price is under the 60 EMA then we are in a downtrend so we sell the tops
 That is when the 4 EMA start to touch the 60 EMA and price touches the top of the SHI channel.
 On TDI you will see a breakthrough on the blue bands.

Your SL will be at the high in the downtrend or low swing in the uptrend
Your TP will be at the bottom of the channel in a downtrend and at the top of the channel in an uptrend or it can be equal to your SL or double or triple your SL
Be sure to check whre the daily PA is heading.
The daily PA should be heading in the same direction


Sunday, September 16, 2012

Metatrader 4 Stochastic Indicator Collections

                                                                      DIGISTOCH


Double Smoothed Stochastic 2


Stochastic DynamicZoneStoch


Stochastic Colored


Stochastic  Floating levels


Stochastic 2SigMAs MTF


Saturday, September 15, 2012

Gold & Silver End of Week Review


Review the latest developments in the commodities markets and analysis the week’s performance.

This session will cover
  End of week summary for Gold, Silver and Oil
  The top trades of the week
  Live market commentary and technical analysis
  Week Ahead: Key events looking forward


Metatrader 4 MACD Indicator Collections

                                                      Dema MACD zones & alerts


FX5 Dema MACD Divergence_v1.1


Macd - Rsi Adaptive


MACD Colored


T3 BbMacd MTF


ZeroLag MACD


Friday, September 14, 2012

The Power of Money Management


The power of money management is incredible. A break-even trading system can become very profitable, even a losing trading system can be turned into a profitable system with proper money management. In this webinar Walter will look at the power of managing trading risk, and how you can identify whether your money management strategies are


Thursday, September 13, 2012

SYNERGY Trading Method


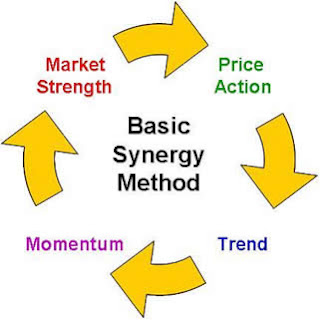
The Synergy Trading Method was developed by Dean Malone and is an effective Forex trading method developed to simplify trading decisions with high probability precision. It combines the market forces of Price Action, Trend, Momentum and Market Strength to produce higher probability trades
With Synergy, traders identify and use two important trading components in real-time: Price Action and Sentiment.

Price Action is market movement, such as the oscillation of Open, High, Low and Close prices. Too often, traders are mesmerized by trivial price flucuations and lose sight of the underlying trend of the market. Many traders tend to jump in and out of the market instead of staying with the trade as a trend develops. Synergy is designed to eliminate price distortions. It reveals periods of market strength and trend and periods of consolidation.

Sentiment is the intuitive feeling or attitude of traders and investors in the market. For example, if the sentiment of the market is bullish, then traders and investors expect an upward move in the market. Often, sentiment is an indication of optimism or pessimism in the market based on recent news announcements or political events. The Synergy method uses a hybrid custom indicator developed to show postive (buyers) sentiment or negative (sellers) sentiment.

Working in unison, Price Action and Sentiment give traders a distinct trading advantage. When both are in agreement, favorable trading conditions exists. For instance, when price action is showing upward movement with buyers sentiment, there is higher probability of a Long position having a favorable outcome. Similarly, when price action has a downward movement in conjunction with sellers sentiment, a short position has a favorable outcome


4 Time Frame MT4 Indicator Collections

                                                            4 time frame awesome oscillator


4 time frame DeMarker

4 time frame Gann HiLo
4 time frame MACD