Tuesday, September 25, 2012

Fed's Plosser: Exit may come well before mid-2015


The Federal Reserve may have to raise short-term interest rates "well before" the current guidance of mid-2015 . 

Charles Plosser, FA Society of Philadelphia and The Bond Club of Philadelphia today . President and Chief Executive Officer of the Federal Reserve Bank of Philadelphia is speaking to the C

He said the that further easing wasn't appropriate nor likely to be effective. In additions, the actions carry with them "significant risks" to the Fed's inflation fighting credibility, he remarked. Plosser was relatively optimistic about the economy, forecasting 3% growth in 2013 and 2014.

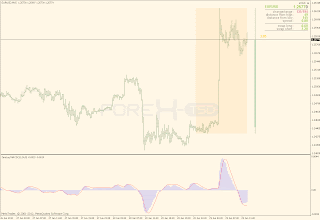
GRaB candles indicator for MT4


GRaB candles indicator for mt4 create by Raghee Horner

Green candles are bullish, red are bearish, and blue is neutral. The color-coding of the candles are based upon where each candle closes: above the 34 period EMA high is green, below the 34 period EMA low is red, and between the 34 period EMA high and 34 period EMA low is blue


S&P lowers forecast for eurozone GDP growth in 2012 and 2013


Standard & Poor's Ratings Services said today that it now expects -0.8% GDP growth in the eurozone in 2012 and flat growth in 2013. For Spain, the forecast is now for a 1.4% contraction next year.

This compares with our previous projections in July for 2012 and 2013 GDP growth of -0.7% and 0.3% for the eurozone, and -0.6% for Spain in 2013.

Monday, September 24, 2012

US Dollar Rebound

Prices re-testing the previously broken bottom of a rising channel set from the September 14 low (now at 9831). A break higher initially exposes the 38.2%Fibonacci retracement at 9857. Near-term support lines up at 9783, the 23.6% Fibonacci expansion, with a break below that targeting the 38.2% expansion at 9738


Via Dailyfx

Sunday, September 23, 2012

SPOUTNIKH Trade System


Entry Long position rules

Open trade when first bar from fisher in H1 and flat trend in H1 are GREEN COLOUR
Exit : When both bar fisher+ flat trend are becoming RED COLOUR  then Close and Reverse


Entry short position rules 

Open trade when first bar from fisher in H1 and flat trend in H1 are becoming RED COLOUR
Exit : When both bar fisher+ flat trend are green COLOUR then Close and Reverse


Wednesday, September 19, 2012

Crude Oil reversal to the downside


Prices broke through support at the bottom of a rising channel carved out since early July to challenge the 38.2% Fibonacci retracement at 91.56. Continued selling below this boundary targets the 50% level at 88.83. The channel bottom – now at 94.54 – has been recast as resistance. A push back above that aims to challenge a falling trend line set from late February at 99.51


Tuesday, September 18, 2012

Gone Fishing Trade System


TIMEFRAME: 4HR, DAILY (Shorter timeframes work but reduced winning %)

INDICATORS: FX Fish, MA_CROSS_OC

SHORT ENTRY

Down Orange arrow AND Red line on FX Fish indicator ENTER AFTER BAR CLOSES

Stop Loss: Last low

Take Profit: Lock in 30-50 pip then wait for closing signal 


LONG ENTRY

Up Blue arrow AND Green line on FX Fish indicator ENTER AFTER BAR CLOSES

Stop Loss: Last low

Take Profit: Lock in 30-50 pip then wait for closing signal

CLOSING SIGNALS

Out trade  if FX Fish turns a different color as well 


Double smoothed stochastic Trade System

This System use Double smoothed stochastic Indicator for Enter trade 

Pair : EURUSD
TF  :  M1 - M5
Sell when both Double smoothed stochastic and XO Indicator same red color

Buy when both Double smoothed stochastic and XO Indicator same Lime color

Set stoploss 20 pip and take profit 10 - 20 pip

Test is need trade demo account only , send comment if you have good filter


Monday, September 17, 2012

Rads Reverse MTF HAS Trading Systems


This is a MTF system and you can see on the chart what is going on on the other time frames. Every time frame will show you the current and the next three higher time frames for reference
Blue Line - main indicator. It is a 27 period T3 moving average

Orange Line - 27 T3 on next higher time frame.

Red Line - 27 T3 on next higher time frame.

Purple Line - 27 T3 on next higher time frame

Maroon Line - 729 EMA

Grey line - 2 period smoothed EMA

HAS and HAS Extension - This gives the main visual indication of the move. I added the extension to help identify false breaks.

Center Window - MTF HAS Bars. These bars show the HAS indicator on the current and next 3 higher time frames.

Bottom Window - T3 Stochastic. Again, somewhat smoother than a regular stochastic. Set to 21-5-3 seems to line up very well with the other indicators

This is a trend following system and so we look to enter and trade with the current trend on whatever time frame we are looking at. We want to identify reversal points and enter as close to the beginning of a trend as possible and add to our positions when possible

EA Trader Manager For Metatrader 4


e-Trailing


Automatic trailing stop for all positions that are open or will be opened in the future

Swiss_Army_EA


Allows managing trades using a large variety of methods: break even stops, trailing stops, setting/removing take profits and stop losses and variety of close-out conditions

TrailingWithPartialClose


Allows partial closing of positions when each target is reached. Includes 6 different types of trailing stops

Stealth TradeManager


Lots of Features with real Buy Sell Button
Copy mt4gui.dll and mt4gui2.dll to C:\Programs\YourMetaTraderplatform , Attach Ea on chart that all

                                    Download  EA Trader Manager For Metatrader 4


X – Man 4H Swing Trade Method


X – Man 4H swing trade method

Time frame - 4H
Pairs- Any pair you feel like trading (look for pairs thats trending)
Times- Any time of the day
Indicators - TDI with the blue bands, Synergy bars , SHI Channel , 4 EMA shift 0 ,
60 EMA shift 0.

Method is as follows :
 When Price is under the 60 EMA then we are in a downtrend so we sell the tops
 That is when the 4 EMA start to touch the 60 EMA and price touches the top of the SHI channel.
 On TDI you will see a breakthrough on the blue bands.

Your SL will be at the high in the downtrend or low swing in the uptrend
Your TP will be at the bottom of the channel in a downtrend and at the top of the channel in an uptrend or it can be equal to your SL or double or triple your SL
Be sure to check whre the daily PA is heading.
The daily PA should be heading in the same direction


Sunday, September 16, 2012

Metatrader 4 Stochastic Indicator Collections

                                                                      DIGISTOCH


Double Smoothed Stochastic 2


Stochastic DynamicZoneStoch


Stochastic Colored


Stochastic  Floating levels


Stochastic 2SigMAs MTF


Saturday, September 15, 2012

Gold & Silver End of Week Review


Review the latest developments in the commodities markets and analysis the week’s performance.

This session will cover
  End of week summary for Gold, Silver and Oil
  The top trades of the week
  Live market commentary and technical analysis
  Week Ahead: Key events looking forward


Metatrader 4 MACD Indicator Collections

                                                      Dema MACD zones & alerts


FX5 Dema MACD Divergence_v1.1


Macd - Rsi Adaptive


MACD Colored


T3 BbMacd MTF


ZeroLag MACD


Friday, September 14, 2012

The Power of Money Management


The power of money management is incredible. A break-even trading system can become very profitable, even a losing trading system can be turned into a profitable system with proper money management. In this webinar Walter will look at the power of managing trading risk, and how you can identify whether your money management strategies are


Thursday, September 13, 2012

SYNERGY Trading Method


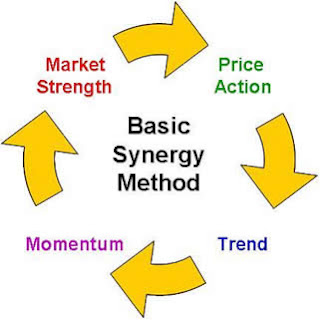
The Synergy Trading Method was developed by Dean Malone and is an effective Forex trading method developed to simplify trading decisions with high probability precision. It combines the market forces of Price Action, Trend, Momentum and Market Strength to produce higher probability trades
With Synergy, traders identify and use two important trading components in real-time: Price Action and Sentiment.

Price Action is market movement, such as the oscillation of Open, High, Low and Close prices. Too often, traders are mesmerized by trivial price flucuations and lose sight of the underlying trend of the market. Many traders tend to jump in and out of the market instead of staying with the trade as a trend develops. Synergy is designed to eliminate price distortions. It reveals periods of market strength and trend and periods of consolidation.

Sentiment is the intuitive feeling or attitude of traders and investors in the market. For example, if the sentiment of the market is bullish, then traders and investors expect an upward move in the market. Often, sentiment is an indication of optimism or pessimism in the market based on recent news announcements or political events. The Synergy method uses a hybrid custom indicator developed to show postive (buyers) sentiment or negative (sellers) sentiment.

Working in unison, Price Action and Sentiment give traders a distinct trading advantage. When both are in agreement, favorable trading conditions exists. For instance, when price action is showing upward movement with buyers sentiment, there is higher probability of a Long position having a favorable outcome. Similarly, when price action has a downward movement in conjunction with sellers sentiment, a short position has a favorable outcome


4 Time Frame MT4 Indicator Collections

                                                            4 time frame awesome oscillator


4 time frame DeMarker

4 time frame Gann HiLo
4 time frame MACD


Friday, September 7, 2012

Pairs Correlations & Stop Hunting Webinar

Dale J. Pinkert will be speaking and demonstrating how he diagnoses the Relative strength and weakness between pairs for preferred long and short candidates as well as indentifying potential Stop loss order zones


Thursday, September 6, 2012

Europe stocks rise as ECB meeting


European stocks in bullish mood ahead of ECB policy decision and Draghi news conference


European stock markets opened higher on Thursday, with banks and miners leading the gains, ahead of the European Central Bank's much anticipated policy meeting later in the day. The Stoxx Europe 600 index +0.67%  rose 0.3% to 266.24

Wednesday, September 5, 2012

Genesis Matrix Trading System Tools


GMTS-Matrix is a non-repainting matrix indicator for use with the Genesis Matrix Trading System
Uses the following indicators:
1. TVI
2. CCI
3. Gann High/Low Activator Indicator
4. T3 Moving Average
Multi time-frame. All bars in the chart corresponding to a higher time-frame bar will be updated to reflect the current state of the higher time-frame indicator.
Optional alert when all 4 indicators line up.
Set labels of your choice.
GMTS-Tape:
GMTS-Tape is a tape chart of the ‘Genesis Matrix Trading System’ Matrix indicator.

GMTS-Dash
GMTS-Dash is a signal dashboard for the ‘Genesis Matrix Trading System’. It displays the current matrix signals for multiple time-frames and the ADR.

Stoch-MTF.mq4
MTF Stochastic with linear interpolation between bars on the higher time-frames. Features:
Linear interpolation of values between bars.
Dots can be used to tag the closing lower time-frame bar on the line.
Dual color to denote rising/over bought and Falling/oversold.


Stoch-MTF.mq4
MTF Stochastic Tape Chart Indicator. Features:

Divider line to group sets of lower time-frame bars to ease reading the chart.
Different colors for rising/overbought and falling/oversold

Credit to Xaphod


Tuesday, September 4, 2012

THV Trader system


The main V4 rules


Entry:  Above Coral only long, below Coral only short
Price crosses cloud - both Trix cross each other and have the same color.
Best and most secure trend confirmation is a cross of the fast Trix on the zero level.

Exit: Faster Trix changes color and/or touch of a known good resistance/support level.

How to install

Step By Step :
1 .Download/unzip/Copy/Save the MQ4/EX4 file into your C:\Program Files\(your broker)MetaTrader 4\experts\indicators folder
2 Copy and paste the template file .tlp in C:\Program Files\(your broker)MetaTrader 4\templates folder.
3 Close your MetaTrader application (assuming it’s currently open … Ignore this if the application hasn’t been launched)
4 Launch your MetaTrader application
5 Open a new chart and right click on it, select the THV template, ready


Extreme TMA System


Entry Rules

1- We will first determine trend in the 3 TMAs by using the TMA Slope indicator values.

Ranging TMA (-0.40 to 0.40): Trades can be placed in both directions.
Buy Only TMA (Above 0.40): Place ONLY Long trades.
Sell Only TMA (Below -0.40): Place ONLY Short trades.
Super Range: Above 0.80: Hold longs till slope value drops under 0.80, at which point you should close all longs.
Below -0.80: Hold shorts till slope value climbs above -0.80, at which point you should close all shorts.

H4, D1, W1 slope values must be either Ranging or higher for Longs or Ranging or lower for shorts.

2- Once trade direction is determined, we will look at the D1 and W1 TMA and determine that there is enough room for the trade to move in your direction before reaching the outer band of both. Example: If you decide to go short, there must be enough room between the current price and the lower D1 band (At least 150 pips) and the lower W1 band (At least 250 pips).

3- We will now wait for price to climb above the top band of the H4 and D1 TMAs at the same time, before placing a Short trade or below the bottom band of the H4 and D1 TMAs at the same time, before placing a Long trade.

4- The Trigger: Once Rule 3 is complied with, the trade will be entered once price turns around and touches the H4 Upper TMA band for Shorts or the H4 Lower TMA band for Longs. Refer to Rule one again before entering trade to make sure that the 3 TMA slope values are still Ranging or in the direction of your trade. If they are not, wait until they return to the correct slope values for your trade and enter then.


Even though not explicitly mentioned in the rules, it is always a good idea to sell from under tested support and buy from above tested resistance. This is always a good rule to follow. It will prevent getting into a trade too early and will increase your percentage of winners. Valid support and resistance areas are: 50 or 200 MAs, TMA centerlines, daily, weekly and monthly pivot lines, etc.


Exit Rules for each type of trade


Short Term Trade (If used): Close the trade when price reaches the opposite H1 TMA band. Reenter trade when price retraces to the centerline of the H1 TMA. Make sure all slope values continue to be either ranging or in the direction of your trade before reentering. You can do this several times during a strong trending move.

Medium Term Trade (Standard trade): Close the trade when price reaches the opposite H4 TMA band. Reenter trade when price retraces to the centerline of the H4 TMA. Make sure all slope values continue to be either ranging or in the direction of your trade before reentering. You can do this several times during a strong trending move.

Position Trade: Close the trade when price reaches the opposite D1 TMA band. Reenter trade when price retraces to the centerline of the D1 TMA. Make sure all slope values continue to be either ranging or in the direction of your trade before reentering. You can do this several times during a strong trending move.

Credit to Alfredo


Symphonie Trader System


Symphonie Trader System

Named for the combination of indicators used to determine tops and bottoms for placing entry orders and exit strategy to maximize profit. These four forces at work in the marketplace are; Trend, Emotion, Sentiment, and Extreme and each one reinforces the other. The Symphonie Trader System works together like the components of a Symphonie. Alone each instrument has a weak sound, but; when put together the complete symphonie makes beautiful music rich in sound and texture

The four Indicators are:

Symphonie Extreme Indicator
Symphonie Emotion Indicator
Symphonie Sentiment Indicator
Symphonie Trendline Indicator

Entry Points Strategy

The entry and exit strategy is simple. For placing an order one would wait until you have an extreme spike (opposing colour change) and the other 3 indicators show the same colour in the direction of the extreme value


Symphonie Trader System


Sonic R. System


Sonic R. System is a method of trading price movements between areas of support and resistance. It trades on the M15 chart. Technical indicators called the DRAGON and the TREND. The DRAGON is used for picking the trade entry. The TREND is used to confirm the correct trade direction. Historic S&R is used for picking the trade exit

TREND
This is a market bias indicator and it is best if PA is above it for longs and below it for shorts.

DRAGON
Must be angled up with PA above it for longs, and angled down with PA below it for shorts


TIMING
Prefer not to open trade during asian session. Recommend London session for best momentum

PAIRS
Prefer to trade the pair EUR/USD. Lowest spread. Usually a wide range. Most important is it is most traded pair, which means better volume and better momentum for the trade

Placement Of TP
Select a historic S&R level. Such levels can include whole/half/quarter numbers and the middle of consolidation areas

Placement of SL
1. The SL must be beyond the H/L (for shorts/longs) of the recent large scale price swing.
2. The SL must not be more than 100-120 pips 

Credit to sonicdeejay